Statistics Dashboard
Review sales trends, gross profit, and product-class performance with charts and the exact figures alongside them.
What it does
Review sales trends, gross profit, and product-class performance with charts and the exact figures alongside them.
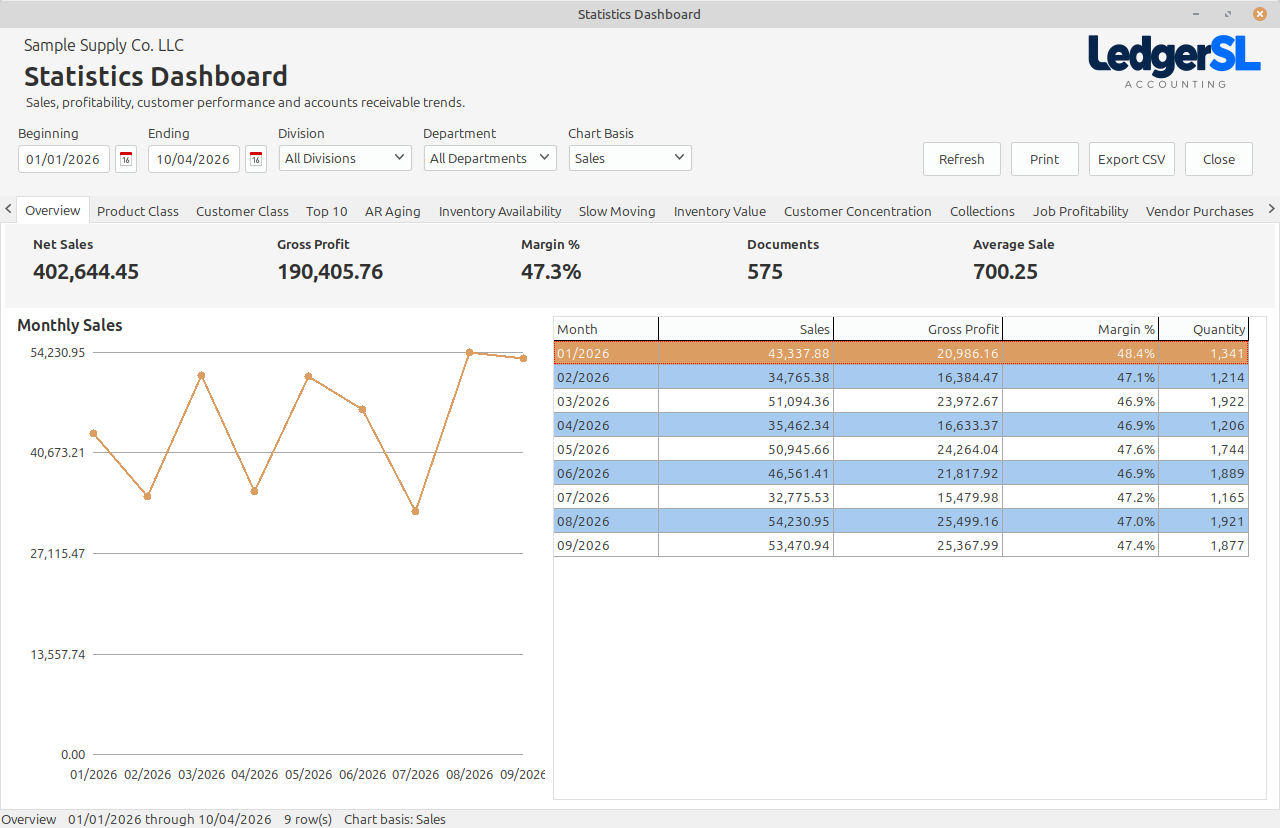
Use Overview to review net sales, gross profit, margin, document count, average sale, and monthly sales trends.
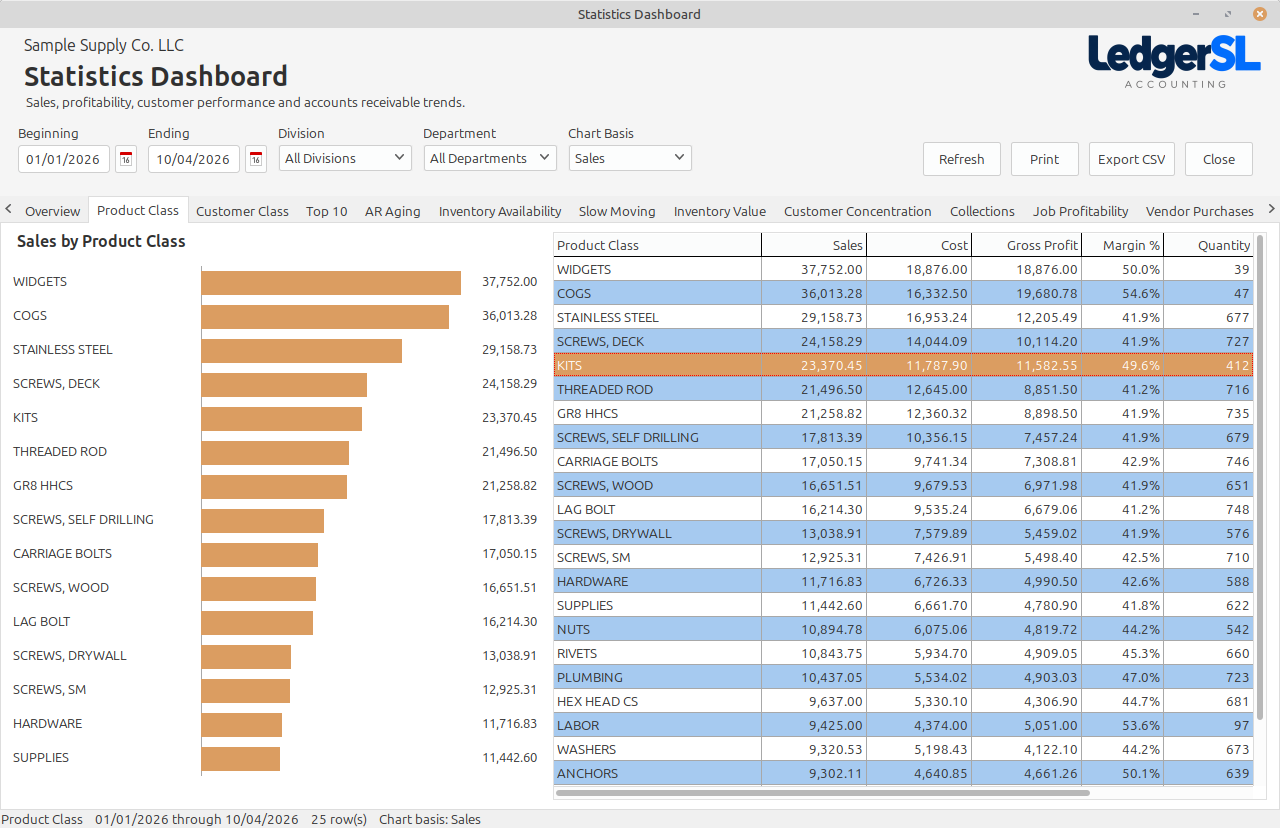
Compare product classes by sales, cost, gross profit, margin, and quantity to see how each category contributes.
Choose a date range, division, and department to review the whole company or a particular operating area.
Explore additional tabs for customers, receivables, inventory, collections, job profitability, and vendor purchases.
Print the results or export CSV for further review.
A single-location company can use one meaningful location, division, and department. A business with several locations or operating areas can add the detail it needs without changing the accounting workflow.